K-means Clustering from Scratch
NumPy is all you need

An Algorithm must be seen to be believed — Donald Knuth
Overview
The science of Machine Learning can be broadly classified into two categories:
In this blog post, we will be implementing a popular unsupervised learning algorithm, k-means clustering.
This popular algorithm uses numerical distance measures to partition data into clusters.
Algorithm
Let’s say we have a bunch of observations and we want to segment “similar” observations together. We will use the following algorithm to achieve our goal.
K-means algorithm
Input: k (number of clusters), D (data points)
- Choose random k data points as initial clusters mean
- Associate each data point in D to the nearest centroid.
This will divide the data into k clusters. - Recompute centroids
- Repeat step 2 and step 3 until there are no more changes
of cluster membership of the data points.
Let us look at the above algorithm in a bit more detail.
We first assign each data point to a cluster randomly. We then compute the cluster means for each group of clusters.
After that, we proceed to compute the squared Euclidian distance between each point and cluster means. We then assign a cluster to each data point based on the smallest squared euclidian distance between that data point and the cluster means for each cluster.
If one were to ask a statistician, she/he might tell you that we are trying to minimize the within-cluster sum of squares (WCSS). Let’s now try to implement this algorithm in Python.
Implementation
Though there are many library implementations of the k-means algorithm in Python, I decided to use only Numpy in order to provide an instructive approach. Numpy is a popular library in Python used for numerical computations.
Code Walkthrough
import numpy as np
import tqdm
import itertools
import matplotlib.pyplot as plt


class Kmeans:
    def __init__(self, k=3):
        self.k = k
        self.means = None
        self._cluster_ids = None
We first create a class called Kmeans and pass a single constructor argumentk to it. This argument is a hyperparameter. Hyperparameters are parameters that are set by the user before training the machine learning algorithm. In our case, this is the total number of clusters we wish to partition our data into. We also add two more attributes to the constructor, means which will store the cluster means and _cluster_ids which stores the id values of the clusters.
import numpy as np
import tqdm
import itertools
import matplotlib.pyplot as plt


class Kmeans:
    def __init__(self, k=3):
        self.k = k
        self.means = None
        self._cluster_ids = None

    @property
    def cluster_ids(self):
        return self._cluster_ids

    def _init_centroid(self, m):
        return np.random.randint(0, self.k, m)
We then create a method called cluster_ids which acts as a get method for our cluster ids. @property is a function decorator. To learn more about this, check out this article. Another method called _init_centroid is created to randomly assign each data point to a cluster.
import numpy as np
import tqdm
import itertools
import matplotlib.pyplot as plt


class Kmeans:
    def __init__(self, k=3):
        self.k = k
        self.means = None
        self._cluster_ids = None

    @property
    def cluster_ids(self):
        return self._cluster_ids

    def _init_centroid(self, m):
        return np.random.randint(0, self.k, m)

    def _cluster_means(self, X, clusters):
        m, n = X.shape[0], X.shape[1]
        # Extra column to store cluster ids
        temp = np.zeros((m, n + 1))
        temp[:, :n], temp[:, n] = X, clusters
        result = np.zeros((self.k, n))
        for i in range(self.k):
            subset = temp[np.where(temp[:, -1] == i), :n]
            if subset[0].shape[0] > 0:
                result[i] = np.mean(subset[0], axis=0)
            # Choose random data point if a cluster does not
            # have any data associated with it
            else:
                result[i] = X[np.random.choice(X.shape[0], 1, replace=True)]

        return result

    def _compute_cluster(self, x):
        # Computes closest means to a data point x
        return min(range(self.k), key=lambda i: np.linalg.norm(x - self.means[i])**2)
_cluster_means computes the means of our clusters. It accepts a Numpy array containing the data and another Numpy array which has the cluster ids as input. We use a temporary array temp to store our features and the cluster ids. We then compute the means of every data point in each cluster and return it as an array.
Note that there could be some clusters which may not have any data (because we randomly assign clusters initially). Hence, if there is a cluster with no data, we randomly select an observation to be a part of that cluster.
_compute_cluster is the method that determines which cluster’s means are closest to a data point. The np.linalg.norm() method does the computation for the euclidean distance. We square this to get the within-cluster sum of squares.
import numpy as np
import tqdm
import itertools
import matplotlib.pyplot as plt


class Kmeans:
    def __init__(self, k=3):
        self.k = k
        self.means = None
        self._cluster_ids = None

    @property
    def cluster_ids(self):
        return self._cluster_ids

    def _init_centroid(self, m):
        return np.random.randint(0, self.k, m)

    def _cluster_means(self, X, clusters):
        m, n = X.shape[0], X.shape[1]
        # Extra column to store cluster ids
        temp = np.zeros((m, n + 1))
        temp[:, :n], temp[:, n] = X, clusters
        result = np.zeros((self.k, n))
        for i in range(self.k):
            subset = temp[np.where(temp[:, -1] == i), :n]
            if subset[0].shape[0] > 0:
                result[i] = np.mean(subset[0], axis=0)
            # Choose random data point if a cluster does not
            # have any data associated with it
            else:
                result[i] = X[np.random.choice(X.shape[0], 1, replace=True)]

        return result

    def _compute_cluster(self, x):
        # Computes closest means to a data point x
        return min(range(self.k), key=lambda i: np.linalg.norm(x - self.means[i])**2)

    def fit(self, X, num_iterations=None):
        m = X.shape[0]
        # Initialize clusters
        initial_clusters = self._init_centroid(m)
        new_clusters = np.zeros(initial_clusters.shape)
        with tqdm.tqdm(itertools.count()) as t:
            for _ in t:
                # Compute cluster means
                self.means = self._cluster_means(X, initial_clusters)
                for i in range(m):
                    # Assign new cluster ids
                    new_clusters[i] = self._compute_cluster(X[i])
                # Check for data points that have switched cluster ids.
                count_changed = (new_clusters != initial_clusters).sum()
                if count_changed == 0:
                    break
                initial_clusters = new_clusters
                t.set_description(f"changed: {count_changed} / {X.shape[0]}")

        self._cluster_ids = new_clusters
Finally, we create the fit method that orchestrates the clustering process.
Steps in fit() method:
- We first initialize each observation to a cluster. We also create an array of zeroes to store the new cluster ids.
- We then use the function
itertools.count()to create an infinite loop and compute cluster means. - We then assign new cluster ids based on the squared distance between the cluster means and each data point.
- We then check if any data points changed clusters. If they did, then we use the new cluster ids to recompute the cluster means.
- Steps 2 to 4 are repeated until no data points change clusters.
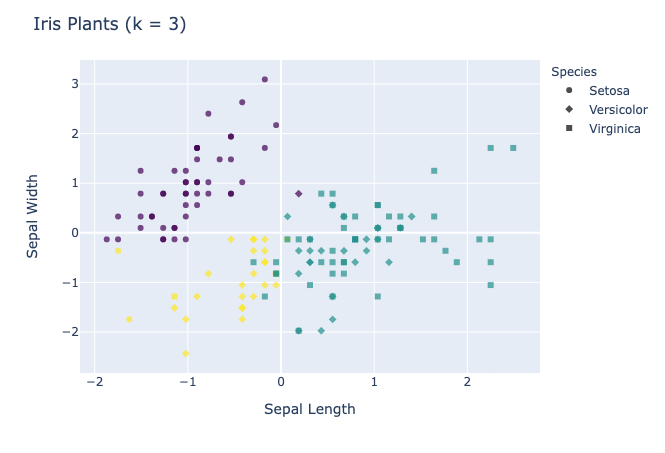
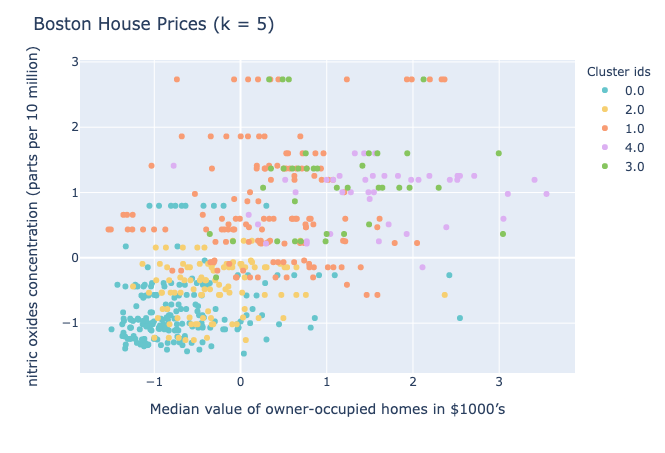
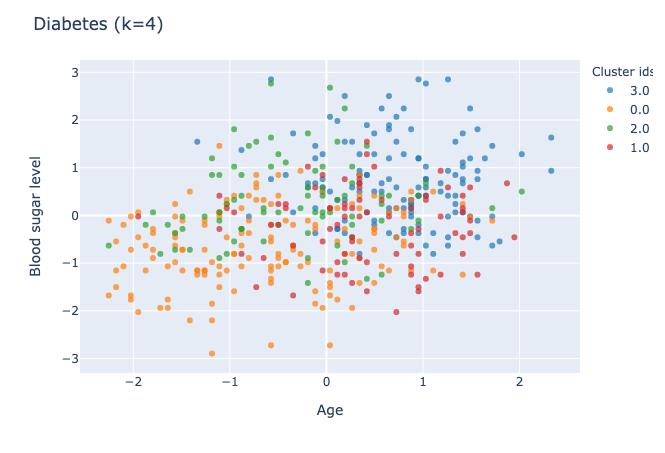
And there you have it, folks! You have successfully created your own k means clustering class capable of clustering data. Here are some results on a few datasets:
Visualizations
Choosing the value of k
Since k is a hyperparameter, we have to have some methodology in order to pick an optimal value of k. One popular method is the elbow method.
In short, the elbow method plots a curve of the number of clusters vs percentage of explained variation. The curve produced by the elbow method is used by practitioners to determine the optimal number of clusters by following the law of diminishing returns.
If adding an extra cluster does not significantly improve the variation of k, we choose to stick to the current number of clusters.
Tips and Optimizations
Here are a couple of tips to ensure good clustering is obtained:
- Removing non-numeric features:
Data may have non-numeric (categorical) features represented as numeric features. Instead of the numbers having some quantitative value, they might be used as labels for a group. For eg. if we are dealing with a population dataset, a column named “Gender” may have values 0 and 1 representing Male and Female. We must be careful in removing these features as they do not have any quantitative value and hence, will distort our algorithm’s notion of ‘distance’. - **Feature Scaling:
**Numeric data will have different ranges. A particular feature with a huge range may adversely impact our clustering objective function. The feature with the big range values will dominate the clustering process over other features. Hence, it is crucial to scale our data so that the contribution of each feature is proportional to the algorithm. - **Better Initialization:
**In our algorithm, we randomly assign the initial clusters to the data. Because of this inherent randomness, our algorithm may not always provide good clusters. There are a couple of ways by which the criterion for setting the initial clusters is improved. The k-means++ algorithm is a popular choice for this task. - **Different Algorithms:
**There are certain algorithms that are variants of the k-means algorithm which are more robust in handling certain constraints such as outliers. One such algorithm is the k-medoids. The k-medoids algorithm uses L1 distance instead of L2 distance (Euclidean distance). There are a bunch of other clustering algorithms that are useful for specific applications such as hierarchal clustering, density-based clustering, fuzzy clustering, etc.
Conclusion
I hope all of you enjoyed this blog post. For more articles on Data Science check out my other posts on medium. Feel free to connect with me on LinkedIn. The code for this blog post is on my Github.